Sales analysis
On this page, you will find information about the data and insights available on the Sales Analysis page in your seller account.
What is the sales analysis?
Go to ‘Analysis’ and then choose 'Sales Analysis'. In the Sales Analysis, you can analyze your sales performance. Up to 2 years of historical data is available. You select the period for which you want to view your sales and against which reference period you want to compare your results, allowing you to identify trends.
The page is built with different tabs, each offering unique insights into your product range and corresponding data points.
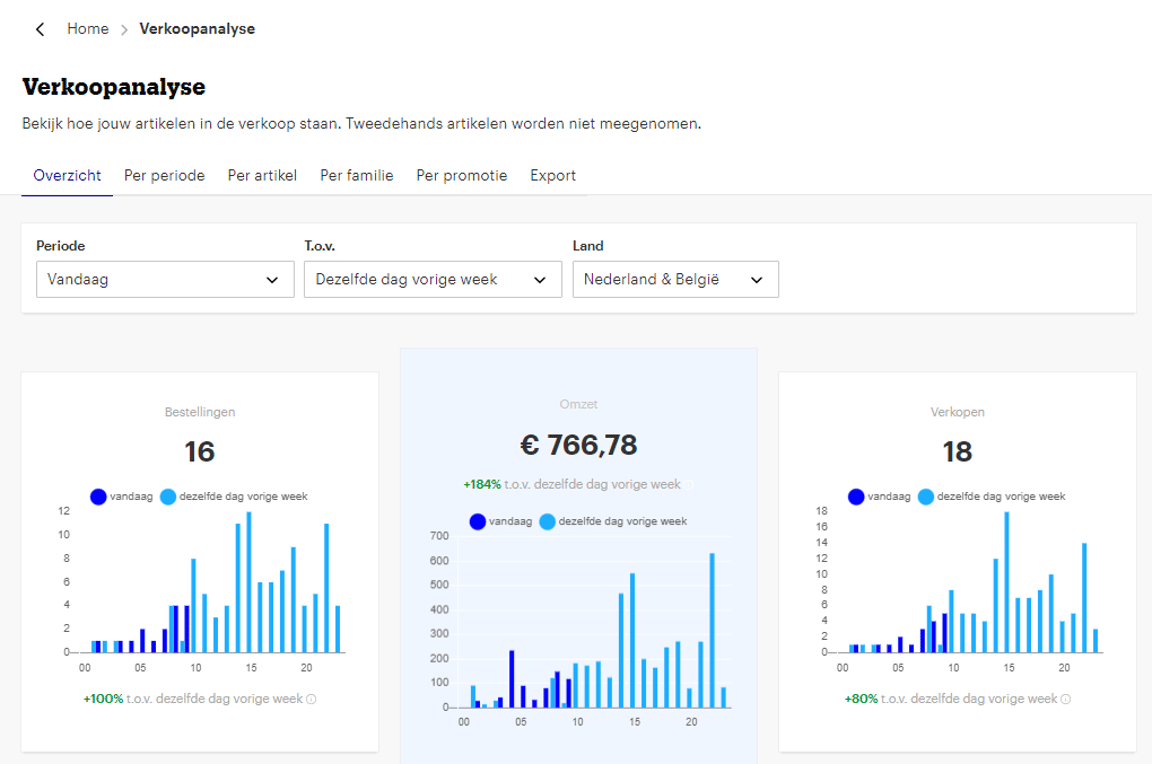
Overview
- Orders
The total number of orders you have received. If a customer orders multiple items at the same time, we count this as a single order. It does not matter how many units the customer ordered or how many shipments you created to send the orders. - Revenue
The total revenue (excluding VAT) you have generated from item sales. Revenue is the sum of all items you have sold multiplied by the selling price you set for them, excluding VAT. An estimate of the VAT rate is used for VAT deduction. The actual rate may differ from this estimate. You are responsible for applying the correct VAT rate. bol is not liable for any damages, of any kind whatsoever. - Sales
The total number of units (items) you have sold. - Best-selling items
Contains 2 tables that provide insight into which items you sell the most and which items generate the most revenue. The percentages in the table indicate how your items perform compared to the reference period at the top of the page. Click on “View all” if you want to see more items than just your top 5. - Biggest risers and fallers
Contains 2 tables that indicate which 5 items from your product range have seen the biggest relative increase in sales compared to the reference period, and which have seen the biggest decrease. The difference between the current period and the reference period is expressed here as the number of units you have sold more or less.
By period
On this tab, in addition to “Orders”, “Revenue”, and “Sales”, two other data points are available: “Visits” and “Conversion”. The data is also presented in a table, and you can export the table to use the data as you see fit, for example, in Excel. Depending on the length of the period you select, the data in the table will be aggregated daily, weekly, or monthly.
- Visits
The number of customer visits to the item page for items you sell when you are in the buy box. Customer visits to the item page for an item you sell, but for which a competitor currently holds the buy box, are not included in this number. - Conversion
The percentage of customers who visited the item page for items you sell (when you are in the buy box) and then proceeded to purchase. If a customer buys an item from you when you are not in the buy box, we do not count a customer visit but we do count conversion. Your conversion rate is then 100%.
By item
This tab contains a table where you can view each item you have sold up to 2 years ago and/or currently have in your offer. You can see the item's performance in terms of revenue, sales, visits, orders, and conversion. The search bar on the page allows you to look up a single item using its product title, internal reference, or EAN. The columns in the table can be sorted from low to high or high to low. The rows in the table also contain information on how the item performs compared to the reference period.
It is possible to export the performance of your best-selling items. The export contains a maximum of 25,000 items and shows the same information as in the table. Please note: if the exported file contains historical data for items you no longer have in your offer, the “EAN” field will be empty due to a technical limitation.
By family
This tab contains the same information as the “By item” tab, but the difference is that all items that together form a product family (products that are variants of each other) are grouped. This allows you to easily see how the different product variants perform relative to each other.
By promotion
This tab provides insight into all promotions you have participated in with one or more items. Before you can see results on this page, you must first select a promotion. You will then gain insight into the promotion's results in terms of revenue, sales, visits, orders, and conversion.
The graph shows how the promotion performed overall. Below the graph, a table is available showing the results of individual items that were part of the promotion. For both the overall picture of the promotion and for each participating item, it is possible to see how the performance was compared to a reference period. For promotions, this is especially valuable because it allows you to determine the effect of your promotion compared to a (comparable) period in which, for example, you had not set a price reduction.
Export
Via the export tab, you can export sales data at daily and item level (for a maximum of 14 days). The export will then have a breakdown by day and item. You can also filter by a brand you offer, by country, and by a specific period. If you leave the optional filters empty, you will export the entire relevant product range. Items without sales or visits will not appear in the export.